Forecasting the Argentinian "Blue Dollar"

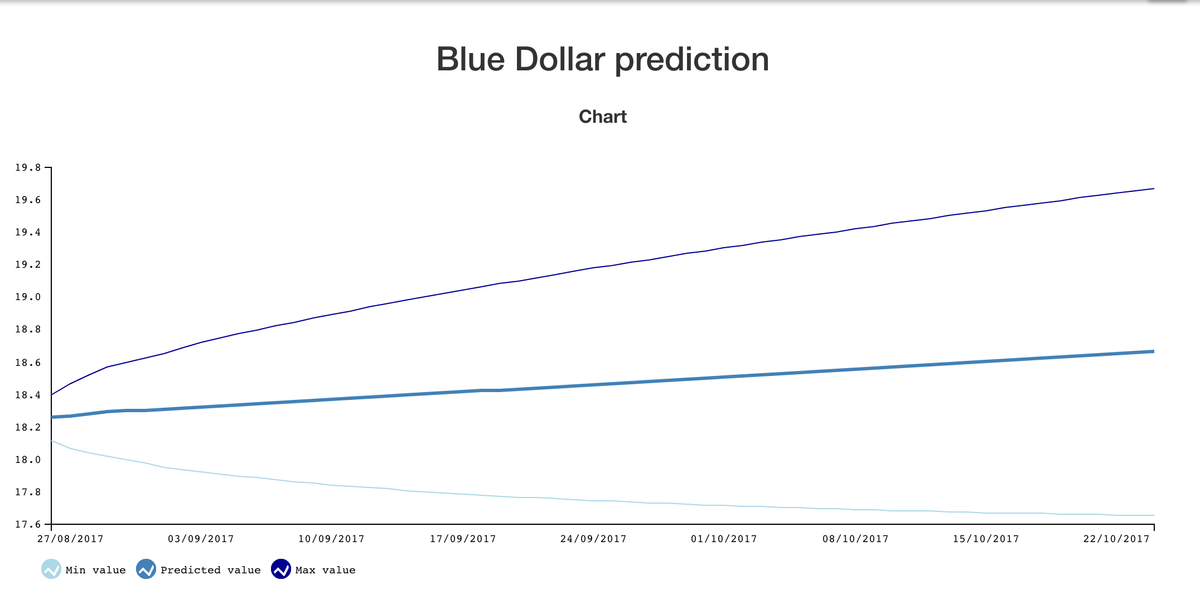
If you have visited recently my website, Bluelytics, you will notice there is a new section named "Predicción", which is a forecast of the value of the Blue Dollar in a 12-month horizon.
You can find it at http://bluelytics.com.ar/#/forecast
You will find that it has a minimun value and a maximun value for each month, and it's included in the graph, why include those values? Because it represents the values between it can be expected that the values may vary, in this case with a 80% confidence (The more confidence you ask, the bigger this band is)
This basically means, for example now that we have the following Forecast:
| Mes | Valor minimo predicho | Valor predicho | Valor maximo predicho |
|---|---|---|---|
| 08/2014 | 11.48 | 12.146 | 12.813 |
This means that i can tell you with 80% confidence, that the value will be between 11.48 and 12.813.
How did i create a Forecaster for Bluelytics, and am showing such a nice graph that is updated everyday? Let me explain step by step
1 - Data acquisition
The data is adquired every hour by three scrapers which feed data to the whole system, which all share the same values. The scrapers are made in CasperJS (Javascript), but they could as well have been created in Scrapy (Python) or any other competent scraper. I just chose that one because it was the one i knew at the time, i would have chosen Scrapy if i had to make the decision now.
The buy/sell values are stored in a PostgreSQL database, which is accesed by Django to show most of the data shown on the website.
2 - Data transformation
As the prediction you have seen is Monthly, with a 12-month horizon, i had to create a transformation, here i'm already starting to develop with R, using the RStudio interface. As a transformation i execute the following query within R, with the RPostgreSQL package.
select
	avg(value_sell) as value, date_trunc('month', date) as date
from
	dolar_blue_dolarblue
where
	source_id <> 'oficial' group by date_trunc('month', date)
order
	by date
;
This gets me a row for each month, with the average of the sell value, and is useful for loading the data into a time series.
3 - Using the R forecast package
To use this data in R to make a prediction with the forecast package (Which is the one i'm using), we need to first of all put this data in a time series object.
You can see the whole code in my github, the steps i follow are:
- Separate the input data between training and test (I used 36 months for training, and separated the last 6 months to test on). This step is very important as it allows as to check if our model is not overfitted to the training data. If you make an overfitted model, it will look great on your training data, but most probably it won't work when you have new data.
- Load both data frames into time series objects (ts) with a frequency = 12
- There is a lot of code left over from the analysis i did, you may check them out if you want
- We start fitting models until there is a satisfactory one, not just on training but with similar results on test. The model which worked best for me was an auto.arima, which estimates automatically the parameters used for the model.
- As we used an automated parameter-discovering model, in my case i prefer to save those parameters and execute the model every time with the same parameters. As such the discovered parameters were
order=c(0,1,1), seasonal=c(0,1,0)
4 - Publishing the prediction
Now we have a result, the forecasted values are returned, with the mean value, and the lower and upper values for the 80% and 95% confidence bands. How do we update the data automatically for the website?
The way i chose was exporting to json, using the RJSONIO package. Each time the prediction is run, a .json file is generated which is accesible by HTTP. This way, whenever a user enters the page, the .json data is loaded with Javascript, so no database requests are executed for each user, the file is directly accessed.
The json data obtained is then used to fill the <table> element with all the predictions for the following 12 months, and the same data is fed to a nice graph you can see in the website.
This way all the process is automated, i have to press no keys for this to work, the scrapers and the forecaster already know when to run thanks to cron.
Thanks for reading!