Soccer world cup page rank analysis

Today i have something unusual (at least for me) to share with you; it's an analysis of the world cup matches.
Of course, i have no idea about soccer, but i do know how to transform data, and as such i will show you something i created by scraping data off FIFA's website. I will proceed to explain the whole process in this blog post.
Data Source
For this analysis, i wanted to take into account all matches played in the "preliminary" rounds, as such i created a scrapy python scraper which extracts all match results from the following pages:
http://es.fifa.com/worldcup/matches/preliminaries/africa/index.html
http://es.fifa.com/worldcup/matches/preliminaries/asia/index.html
http://es.fifa.com/worldcup/matches/preliminaries/europe/index.html
http://es.fifa.com/worldcup/matches/preliminaries/nccamerica/index.html
http://es.fifa.com/worldcup/matches/preliminaries/oceania/index.html
http://es.fifa.com/worldcup/matches/preliminaries/southamerica/index.html
http://es.fifa.com/worldcup/matches
The data i extract is the teams playing the match, and the final score of each team. The final format of the csv is:
home,away,area,scoreHome,scoreAway
Data transformation
Here we leave the Python world to enter the R world :) (I know it can also be done with Python, but i haven't explored that part of Python yet)
I created a R script that starts by loading the CSV to a data frame, and then starts grouping and summarizing the values such that i can have the matches expressed as a graph, i want to have a losing team "pointing" to the winning team. This is because i later want to apply the Page Rank algorithm, the one that google uses to rank websites.
If you don't know the page rank algorithm, it basically says "If you are linked to by important websites, then your website is important" (oversimplified).
The format of the graph edge list is:
from,to,weight
Where weight is a value that i determine from the relative importance of the match, i determine it based on the amount of matches played in the same area, or a fixed value if it's not a preliminary match.
Graph analysis
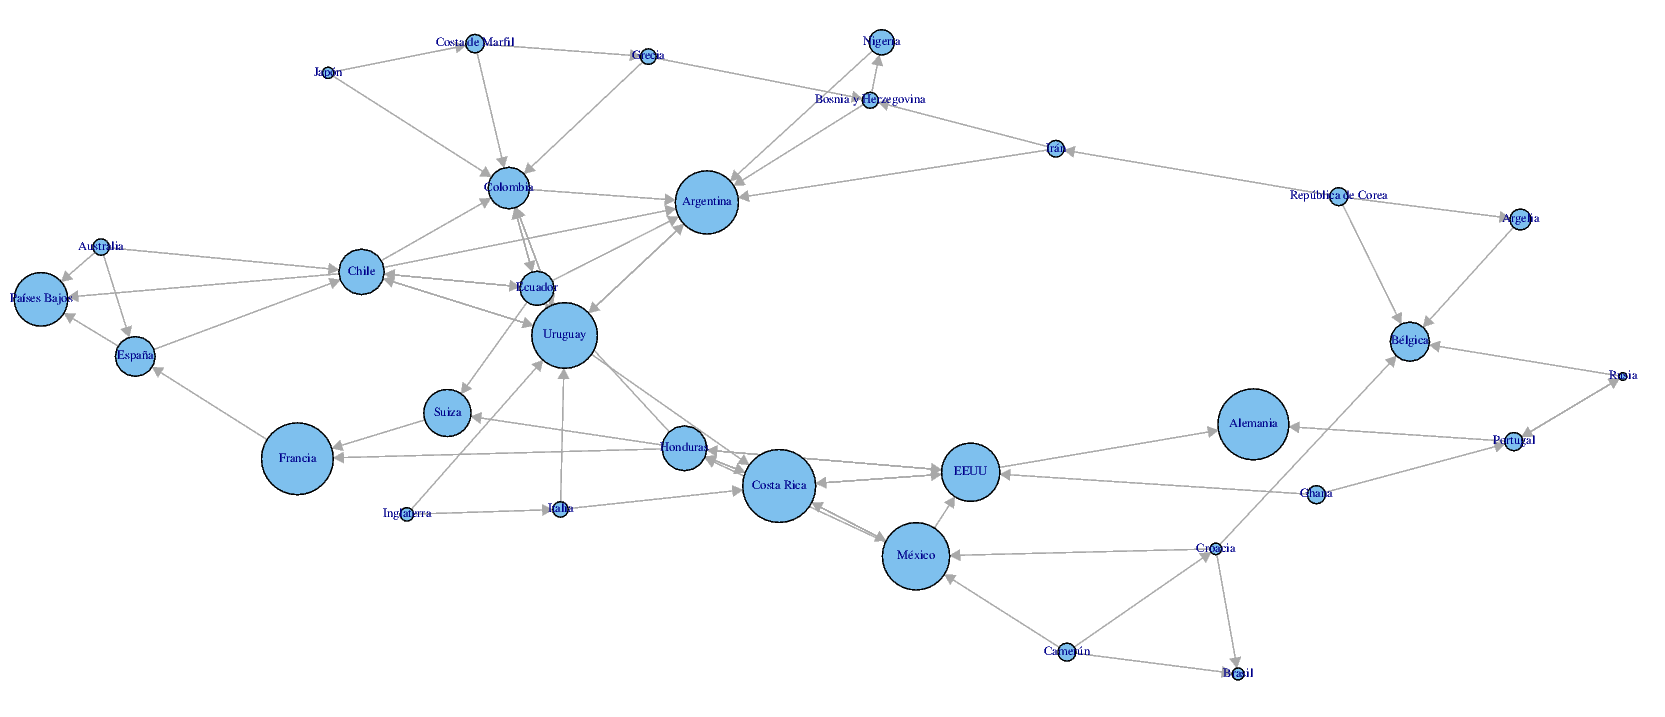
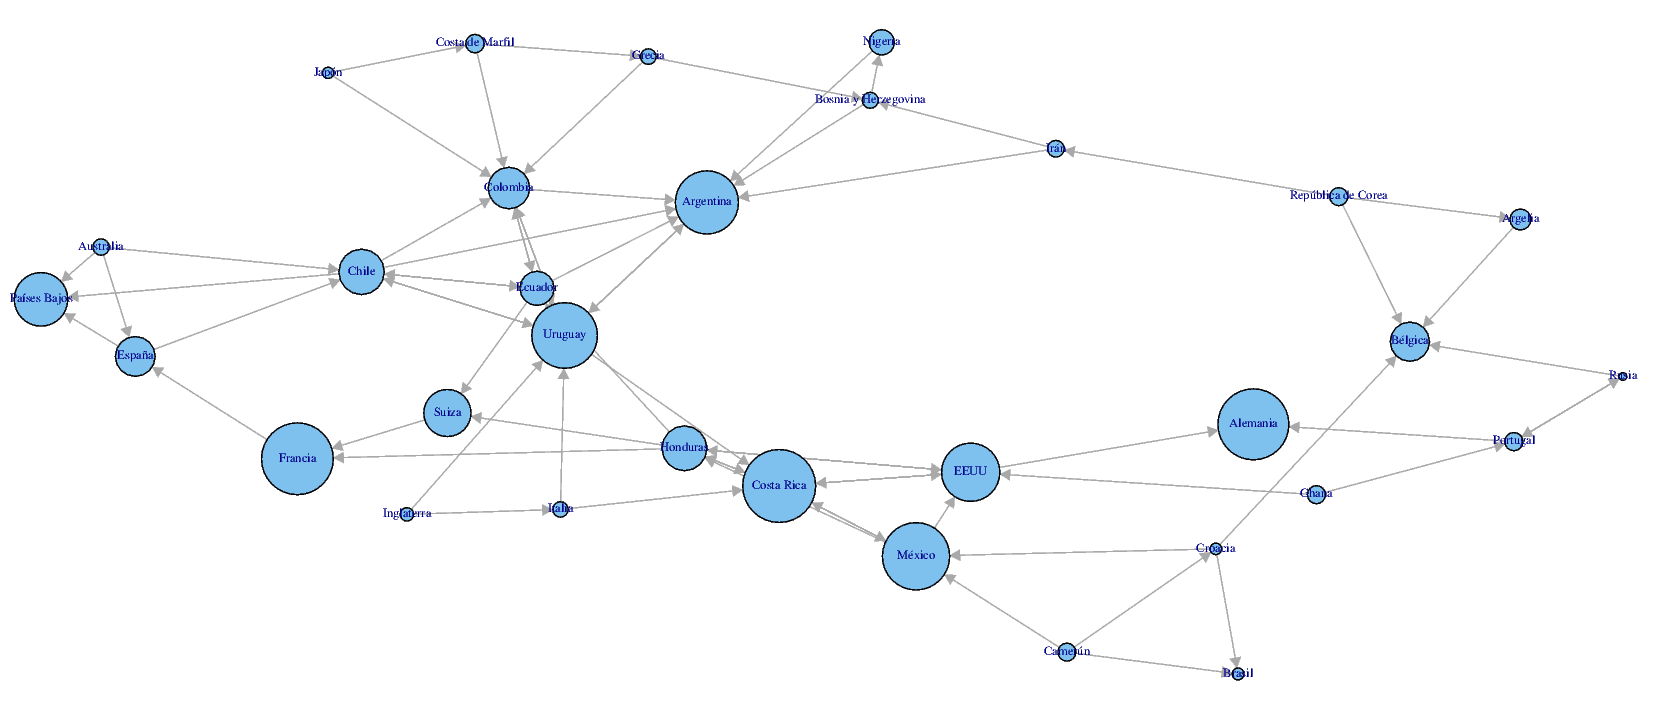
With the data transformed into place, i used the igraph package to create a plot with tkplot to see what i had transformed, you can see the plot with only the classified teams here:
Results
So, what's the result of applying the page rank? As of games played until 27th June, the results are the following (More points is better):
| Position | Team | Page Rank |
|---|---|---|
| 1 | Costa Rica | 350.86 |
| 2 | Francia | 345.10 |
| 3 | Alemania | 341.07 |
| 4 | México | 323.63 |
| 5 | Uruguay | 315.64 |
| 6 | Argentina | 303.62 |
| 7 | EEUU | 280.18 |
| 8 | Países Bajos | 257.48 |
| 9 | Suiza | 226.53 |
| 10 | Chile | 218.52 |
| 11 | Honduras | 215.53 |
| 12 | Colombia | 199.86 |
| 13 | España | 191.62 |
| 14 | Bélgica | 188.58 |
| 15 | Ecuador | 164.52 |
| 16 | Nigeria | 122.12 |
| 17 | Argelia | 100.79 |
| 18 | Costa de Marfil | 88.69 |
| 19 | Portugal | 87.81 |
| 20 | Ghana | 86.88 |
| 21 | República de Corea | 86.59 |
| 22 | Camerún | 86.50 |
| 23 | Irán | 80.28 |
| 24 | Australia | 78.92 |
| 25 | Bosnia y Herzegovina | 76.98 |
| 26 | Grecia | 75.04 |
| 27 | Italia | 74.07 |
| 28 | Inglaterra | 64.73 |
| 29 | Brasil | 57.44 |
| 30 | Croacia | 55.54 |
| 31 | Japón | 54.43 |
| 32 | Rusia | 37.49 |
Show me the mon- i mean the code
The github repository for this analysis is sicarul/worldcup_scraper
The steps to run it are:
- Clone the repo (git clone https://github.com/sicarul/worldcup_scraper)
- Create a virtualenv in the directory (cd worldcup_scraper && virtualenv .)
- Activate the environment (. bin/activate)
- Install dependencies (pip install -r requirements.txt)
- Go into the scraper (cd worldcup)
- Run the scraper (scrapy crawl preliminary -o ../preliminary.csv -t csv)
- Go back into the root of the project (cd ..)
- Run the R script (Rscript analyze.R) <- You will need igraph and plyr installed
Some notes
-
This is not a prediction, as it only reflects on past values, and not on some statistic model.
-
As Brazil didn't have to play preliminary matches, it's score is irrelevant, at least for now
-
Sorry about the team names being in spanish, i had already done everything by the time i realized that.